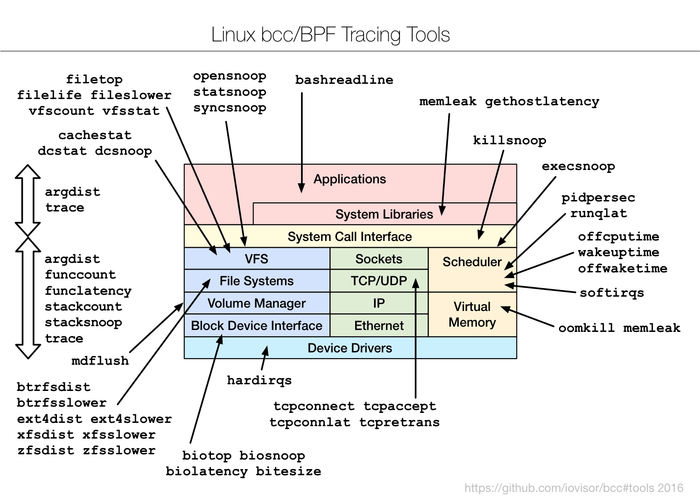
BCC - Linux 성능 모니터링, 네트워킹 등을 위한 동적 추적 도구
BCC(BPF 컴파일러 컬렉션)는 풍부한 커널 추적 및 조작 프로그램을 만드는 데 적합한 강력한 도구 및 예제 파일 세트입니다. 이는 Linux 3.15eBPF로 처음 알려진 확장된 BPF(Berkeley 패킷 필터)를 활용합니다. 강하다>.
실제로 BCC에서 사용되는 대부분의 구성 요소에는 Linux 4.1 이상이 필요하며 주목할만한 기능은 다음과 같습니다.
- 모든 도구는 커널에 내장된 BPF를 기반으로 작동하고 BCC는 Linux 4.x 시리즈에 추가된 기능을 사용하므로 타사 커널 모듈이 필요하지 않습니다.
- 소프트웨어 실행을 관찰할 수 있습니다.
- 예제 파일 및 매뉴얼 페이지와 함께 여러 성능 분석 도구로 구성됩니다.
권장 읽기: Linux 성능을 모니터링하기 위한 20가지 명령줄 도구
고급 Linux 사용자에게 가장 적합한 BCC를 사용하면 C의 커널 계측과 의 프런트엔드를 사용하여 BPF 프로그램을 쉽게 작성할 수 있습니다. Python 및 lua. 또한 성능 분석, 모니터링, 네트워크 트래픽 제어 등 다양한 작업을 지원합니다.
Linux 시스템에 BCC를 설치하는 방법
BCC는 Linux 커널 버전 4.1 이상에 추가된 기능을 사용하며 요구 사항에 따라 커널은 아래 플래그 세트로 컴파일되어야 한다는 점을 기억하세요.
CONFIG_BPF=y
CONFIG_BPF_SYSCALL=y
[optional, for tc filters]
CONFIG_NET_CLS_BPF=m
[optional, for tc actions]
CONFIG_NET_ACT_BPF=m
CONFIG_BPF_JIT=y
CONFIG_HAVE_BPF_JIT=y
[optional, for kprobes]
CONFIG_BPF_EVENTS=y
커널 플래그를 확인하려면 /proc/config.gz 파일을 보거나 아래 예와 같이 명령을 실행하세요.
tecmint@TecMint ~ $ grep CONFIG_BPF= /boot/config-`uname -r`
CONFIG_BPF=y
tecmint@TecMint ~ $ grep CONFIG_BPF_SYSCALL= /boot/config-`uname -r`
CONFIG_BPF_SYSCALL=y
tecmint@TecMint ~ $ grep CONFIG_NET_CLS_BPF= /boot/config-`uname -r`
CONFIG_NET_CLS_BPF=m
tecmint@TecMint ~ $ grep CONFIG_NET_ACT_BPF= /boot/config-`uname -r`
CONFIG_NET_ACT_BPF=m
tecmint@TecMint ~ $ grep CONFIG_BPF_JIT= /boot/config-`uname -r`
CONFIG_BPF_JIT=y
tecmint@TecMint ~ $ grep CONFIG_HAVE_BPF_JIT= /boot/config-`uname -r`
CONFIG_HAVE_BPF_JIT=y
tecmint@TecMint ~ $ grep CONFIG_BPF_EVENTS= /boot/config-`uname -r`
CONFIG_BPF_EVENTS=y
커널 플래그를 확인한 후 Linux 시스템에 BCC 도구를 설치할 차례입니다.
우분투 16.04에서
Ubuntu 16.04용 nightly 패키지만 생성되지만 설치 지침은 매우 간단합니다. 커널을 업그레이드하거나 소스에서 컴파일할 필요가 없습니다.
echo "deb [trusted=yes] https://repo.iovisor.org/apt/xenial xenial-nightly main" | sudo tee /etc/apt/sources.list.d/iovisor.list
sudo apt-get update
sudo apt-get install bcc-tools
우분투 14.04에서
http://kernel.ubuntu.com/~kernel-ppa/mainline에서 4.3+ Linux 커널을 설치하는 것부터 시작하세요.
예를 들어, 아래 내용을 포함하는 작은 쉘 스크립트 “bcc-install.sh”를 작성하세요.
참고: PREFIX 값을 최신 날짜로 업데이트하고 제공된 PREFIX URL에서 파일을 찾아보세요. 실제 REL 값을 가져와 쉘 스크립트에서 대체합니다.
#!/bin/bash
VER=4.5.1-040501
PREFIX=http://kernel.ubuntu.com/~kernel-ppa/mainline/v4.5.1-wily/
REL=201604121331
wget ${PREFIX}/linux-headers-${VER}-generic_${VER}.${REL}_amd64.deb
wget ${PREFIX}/linux-headers-${VER}_${VER}.${REL}_all.deb
wget ${PREFIX}/linux-image-${VER}-generic_${VER}.${REL}_amd64.deb
sudo dpkg -i linux-*${VER}.${REL}*.deb
파일을 저장하고 종료합니다. 실행 가능하게 만든 후 다음과 같이 실행합니다.
chmod +x bcc-install.sh
sh bcc-install.sh
그런 다음 시스템을 재부팅하십시오.
reboot
그런 다음 아래 명령을 실행하여 서명된 BCC 패키지를 설치합니다.
sudo apt-key adv --keyserver keyserver.ubuntu.com --recv-keys D4284CDD
echo "deb https://repo.iovisor.org/apt trusty main" | sudo tee /etc/apt/sources.list.d/iovisor.list
sudo apt-get update
sudo apt-get install binutils bcc bcc-tools libbcc-examples python-bcc
페도라 24-23
시스템 버전이 필요한 버전보다 낮은 경우 http://alt.fedoraproject.org/pub/alt/rawhide-kernel-nodebug에서 4.2+ 커널을 설치하세요. 다음은 이를 수행하는 방법의 예입니다.
sudo dnf config-manager --add-repo=http://alt.fedoraproject.org/pub/alt/rawhide-kernel-nodebug/fedora-rawhide-kernel-nodebug.repo
sudo dnf update
reboot
그런 다음 BBC 도구 저장소를 추가하고 시스템을 업데이트한 후 다음 일련의 명령을 실행하여 도구를 설치합니다.
echo -e '[iovisor]\nbaseurl=https://repo.iovisor.org/yum/nightly/f23/$basearch\nenabled=1\ngpgcheck=0' | sudo tee /etc/yum.repos.d/iovisor.repo
sudo dnf update
sudo dnf install bcc-tools
아치 리눅스 – AUR
먼저 커널을 4.3.1-1 버전 이상으로 업그레이드한 후 pacaur, yaourt<와 같은 Arch 패키지 관리자를 사용하여 아래 패키지를 설치해야 합니다., 위축 등
bcc bcc-tools python-bcc python2-bcc
Linux 시스템에서 BCC 도구를 사용하는 방법
모든 BCC 도구는 /usr/share/bcc/tools 디렉토리에 설치됩니다. 그러나 .py 확장자로 끝나는 /tools 아래의 BCC Github 저장소에서 실행할 수도 있습니다.
$ ls /usr/share/bcc/tools

argdist       capable     filetop         offwaketime  stackcount  vfscount
bashreadline  cpudist     funccount       old          stacksnoop  vfsstat
biolatency    dcsnoop     funclatency     oomkill      statsnoop   wakeuptime
biosnoop      dcstat      gethostlatency  opensnoop    syncsnoop   xfsdist
biotop        doc         hardirqs        pidpersec    tcpaccept   xfsslower
bitesize      execsnoop   killsnoop       profile      tcpconnect  zfsdist
btrfsdist     ext4dist    mdflush         runqlat      tcpconnlat  zfsslower
btrfsslower   ext4slower  memleak         softirqs     tcpretrans
cachestat     filelife    mysqld_qslower  solisten     tplist
cachetop      fileslower  offcputime      sslsniff     trace
일반적인 Linux 시스템 성능 및 네트워킹 모니터링 아래에서 몇 가지 예를 다룰 것입니다.
open() 시스템 호출 추적
먼저 opensnoop을 사용하여 모든 open() 시스템 호출을 추적해 보겠습니다. 이를 통해 데이터 파일, 구성 파일 등을 식별하여 다양한 애플리케이션이 어떻게 작동하는지 알 수 있습니다.
$ cd /usr/share/bcc/tools
$ sudo ./opensnoop

PID    COMM               FD ERR PATH
1      systemd            35   0 /proc/self/mountinfo
2797   udisksd            13   0 /proc/self/mountinfo
1      systemd            35   0 /sys/devices/pci0000:00/0000:00:0d.0/ata3/host2/target2:0:0/2:0:0:0/block/sda/sda1/uevent
1      systemd            35   0 /run/udev/data/b8:1
1      systemd            -1   2 /etc/systemd/system/sys-kernel-debug-tracing.mount
1      systemd            -1   2 /run/systemd/system/sys-kernel-debug-tracing.mount
1      systemd            -1   2 /run/systemd/generator/sys-kernel-debug-tracing.mount
1      systemd            -1   2 /usr/local/lib/systemd/system/sys-kernel-debug-tracing.mount
2247   systemd            15   0 /proc/self/mountinfo
1      systemd            -1   2 /lib/systemd/system/sys-kernel-debug-tracing.mount
1      systemd            -1   2 /usr/lib/systemd/system/sys-kernel-debug-tracing.mount
1      systemd            -1   2 /run/systemd/generator.late/sys-kernel-debug-tracing.mount
1      systemd            -1   2 /etc/systemd/system/sys-kernel-debug-tracing.mount.wants
1      systemd            -1   2 /etc/systemd/system/sys-kernel-debug-tracing.mount.requires
1      systemd            -1   2 /run/systemd/system/sys-kernel-debug-tracing.mount.wants
1      systemd            -1   2 /run/systemd/system/sys-kernel-debug-tracing.mount.requires
1      systemd            -1   2 /run/systemd/generator/sys-kernel-debug-tracing.mount.wants
1      systemd            -1   2 /run/systemd/generator/sys-kernel-debug-tracing.mount.requires
1      systemd            -1   2 /usr/local/lib/systemd/system/sys-kernel-debug-tracing.mount.wants
1      systemd            -1   2 /usr/local/lib/systemd/system/sys-kernel-debug-tracing.mount.requires
1      systemd            -1   2 /lib/systemd/system/sys-kernel-debug-tracing.mount.wants
1      systemd            -1   2 /lib/systemd/system/sys-kernel-debug-tracing.mount.requires
1      systemd            -1   2 /usr/lib/systemd/system/sys-kernel-debug-tracing.mount.wants
1      systemd            -1   2 /usr/lib/systemd/system/sys-kernel-debug-tracing.mount.requires
1      systemd            -1   2 /run/systemd/generator.late/sys-kernel-debug-tracing.mount.wants
1      systemd            -1   2 /run/systemd/generator.late/sys-kernel-debug-tracing.mount.requires
1      systemd            -1   2 /etc/systemd/system/sys-kernel-debug-tracing.mount.d
1      systemd            -1   2 /run/systemd/system/sys-kernel-debug-tracing.mount.d
1      systemd            -1   2 /run/systemd/generator/sys-kernel-debug-tracing.mount.d
....
블록 장치 I/O 지연 시간 요약
이 예에서는 biolatcency를 사용하여 디스크 I/O 대기 시간의 요약된 분포를 보여줍니다. 명령을 실행한 후 몇 분 동안 기다린 후 Ctrl-C를 눌러 명령을 종료하고 출력을 확인합니다.
$ sudo ./biolatecncy

Tracing block device I/O... Hit Ctrl-C to end.
^C
     usecs               : count     distribution
         0 -> 1          : 0        |                                        |
         2 -> 3          : 0        |                                        |
         4 -> 7          : 0        |                                        |
         8 -> 15         : 0        |                                        |
        16 -> 31         : 0        |                                        |
        32 -> 63         : 0        |                                        |
        64 -> 127        : 0        |                                        |
       128 -> 255        : 3        |****************************************|
       256 -> 511        : 3        |****************************************|
       512 -> 1023       : 1        |*************                           |
exec() Syscall을 통해 새 프로세스 추적
이 섹션에서는 execsnoop 도구를 사용하여 실행 중인 새로운 프로세스를 추적하는 방법으로 넘어갑니다. 프로세스가 fork() 및 exec() syscall에 의해 분기될 때마다 출력에 표시됩니다. 그러나 모든 프로세스가 캡처되는 것은 아닙니다.
$ sudo ./execsnoop

PCOMM            PID    PPID   RET ARGS
gnome-screensho  14882  14881    0 /usr/bin/gnome-screenshot --gapplication-service
systemd-hostnam  14892  1        0 /lib/systemd/systemd-hostnamed
nautilus         14897  2767    -2 /home/tecmint/bin/net usershare info
nautilus         14897  2767    -2 /home/tecmint/.local/bin/net usershare info
nautilus         14897  2767    -2 /usr/local/sbin/net usershare info
nautilus         14897  2767    -2 /usr/local/bin/net usershare info
nautilus         14897  2767    -2 /usr/sbin/net usershare info
nautilus         14897  2767    -2 /usr/bin/net usershare info
nautilus         14897  2767    -2 /sbin/net usershare info
nautilus         14897  2767    -2 /bin/net usershare info
nautilus         14897  2767    -2 /usr/games/net usershare info
nautilus         14897  2767    -2 /usr/local/games/net usershare info
nautilus         14897  2767    -2 /snap/bin/net usershare info
compiz           14899  14898   -2 /home/tecmint/bin/libreoffice --calc
compiz           14899  14898   -2 /home/tecmint/.local/bin/libreoffice --calc
compiz           14899  14898   -2 /usr/local/sbin/libreoffice --calc
compiz           14899  14898   -2 /usr/local/bin/libreoffice --calc
compiz           14899  14898   -2 /usr/sbin/libreoffice --calc
libreoffice      14899  2252     0 /usr/bin/libreoffice --calc
dirname          14902  14899    0 /usr/bin/dirname /usr/bin/libreoffice
basename         14903  14899    0 /usr/bin/basename /usr/bin/libreoffice
...
느린 ext4 작업 추적
ext4slower를 사용하여 10ms보다 느린 ext4 파일 시스템 일반 작업을 추적하여 파일을 통해 독립적으로 느린 디스크 I/O를 식별하는 데 도움이 됩니다. 체계.
권장 읽기: 13 Linux 성능 모니터링 도구
임계값을 초과하는 작업만 출력합니다.
$ sudo ./execslower

Tracing ext4 operations slower than 10 ms
TIME     COMM           PID    T BYTES   OFF_KB   LAT(ms) FILENAME
11:59:13 upstart        2252   W 48      1          10.76 dbus.log
11:59:13 gnome-screensh 14993  R 144     0          10.96 settings.ini
11:59:13 gnome-screensh 14993  R 28      0          16.02 gtk.css
11:59:13 gnome-screensh 14993  R 3389    0          18.32 gtk-main.css
11:59:25 rs:main Q:Reg  1826   W 156     60         31.85 syslog
11:59:25 pool           15002  R 208     0          14.98 .xsession-errors
11:59:25 pool           15002  R 644     0          12.28 .ICEauthority
11:59:25 pool           15002  R 220     0          13.38 .bash_logout
11:59:27 dconf-service  2599   S 0       0          22.75 user.BHDKOY
11:59:33 compiz         2548   R 4096    0          19.03 firefox.desktop
11:59:34 compiz         15008  R 128     0          27.52 firefox.sh
11:59:34 firefox        15008  R 128     0          36.48 firefox
11:59:34 zeitgeist-daem 2988   S 0       0          62.23 activity.sqlite-wal
11:59:34 zeitgeist-fts  2996   R 8192    40         15.67 postlist.DB
11:59:34 firefox        15008  R 140     0          18.05 dependentlibs.list
11:59:34 zeitgeist-fts  2996   S 0       0          25.96 position.tmp
11:59:34 firefox        15008  R 4096    0          10.67 libplc4.so
11:59:34 zeitgeist-fts  2996   S 0       0          11.29 termlist.tmp
...
PID 및 대기 시간이 있는 추적 블록 장치 I/O
다음으로, biosnoop을 사용하여 프로세스 ID, 섹터, 바이트, 대기 시간 등의 세부 정보를 사용하여 초당 디스크 I/O당 한 줄을 인쇄하는 방법을 살펴보겠습니다.
$ sudo ./biosnoop

TIME(s)        COMM           PID    DISK    T  SECTOR    BYTES   LAT(ms)
0.000000000    ?              0              R  -1        8          0.26
2.047897000    ?              0              R  -1        8          0.21
3.280028000    kworker/u4:0   14871  sda     W  30552896  4096       0.24
3.280271000    jbd2/sda1-8    545    sda     W  29757720  12288      0.40
3.298318000    jbd2/sda1-8    545    sda     W  29757744  4096       0.14
4.096084000    ?              0              R  -1        8          0.27
6.143977000    ?              0              R  -1        8          0.27
8.192006000    ?              0              R  -1        8          0.26
8.303938000    kworker/u4:2   15084  sda     W  12586584  4096       0.14
8.303965000    kworker/u4:2   15084  sda     W  25174736  4096       0.14
10.239961000   ?              0              R  -1        8          0.26
12.292057000   ?              0              R  -1        8          0.20
14.335990000   ?              0              R  -1        8          0.26
16.383798000   ?              0              R  -1        8          0.17
...
추적 페이지 캐시 적중/실패 비율
그런 다음 cachestat을 사용하여 시스템 캐시에서 매초 한 줄의 요약 통계를 표시합니다. 이는 낮은 캐시 적중률과 높은 누락률을 지적하여 시스템 튜닝 작업을 가능하게 합니다.
$ sudo ./cachestat

 HITS   MISSES  DIRTIES  READ_HIT% WRITE_HIT%   BUFFERS_MB  CACHED_MB
       0        0        0       0.0%       0.0%           19        544
       4        4        2      25.0%      25.0%           19        544
    1321       33        4      97.3%       2.3%           19        545
    7476        0        2     100.0%       0.0%           19        545
    6228       15        2      99.7%       0.2%           19        545
       0        0        0       0.0%       0.0%           19        545
    7391      253      108      95.3%       2.7%           19        545
   33608     5382       28      86.1%      13.8%           19        567
   25098       37       36      99.7%       0.0%           19        566
   17624      239      416      96.3%       0.5%           19        520
...
TCP 활성 연결 추적
tcpconnect를 사용하여 매초 TCP 연결을 모니터링합니다. 출력에는 소스 및 대상 주소와 포트 번호가 포함됩니다. 이 도구는 예상치 못한 TCP 연결을 추적하는 데 유용하므로 애플리케이션 구성이나 공격자의 비효율성을 식별하는 데 도움이 됩니다.
$ sudo ./tcpconnect

PID    COMM         IP SADDR            DADDR            DPORT
15272  Socket Threa 4  10.0.2.15        91.189.89.240    80
15272  Socket Threa 4  10.0.2.15        216.58.199.142   443
15272  Socket Threa 4  10.0.2.15        216.58.199.142   80
15272  Socket Threa 4  10.0.2.15        216.58.199.174   443
15272  Socket Threa 4  10.0.2.15        54.200.62.216    443
15272  Socket Threa 4  10.0.2.15        54.200.62.216    443
15272  Socket Threa 4  10.0.2.15        117.18.237.29    80
15272  Socket Threa 4  10.0.2.15        216.58.199.142   80
15272  Socket Threa 4  10.0.2.15        216.58.199.131   80
15272  Socket Threa 4  10.0.2.15        216.58.199.131   443
15272  Socket Threa 4  10.0.2.15        52.222.135.52    443
15272  Socket Threa 4  10.0.2.15        216.58.199.131   443
15272  Socket Threa 4  10.0.2.15        54.200.62.216    443
15272  Socket Threa 4  10.0.2.15        54.200.62.216    443
15272  Socket Threa 4  10.0.2.15        216.58.199.132   443
15272  Socket Threa 4  10.0.2.15        216.58.199.131   443
15272  Socket Threa 4  10.0.2.15        216.58.199.142   443
15272  Socket Threa 4  10.0.2.15        54.69.17.198     443
15272  Socket Threa 4  10.0.2.15        54.69.17.198     443
...
위의 모든 도구는 다양한 옵션과 함께 사용할 수도 있습니다. 특정 도구에 대한 도움말 페이지를 활성화하려면 -h 옵션을 사용하세요. 예를 들면 다음과 같습니다.
$ sudo ./tcpconnect -h

usage: tcpconnect [-h] [-t] [-p PID] [-P PORT]

Trace TCP connects

optional arguments:
  -h, --help            show this help message and exit
  -t, --timestamp       include timestamp on output
  -p PID, --pid PID     trace this PID only
  -P PORT, --port PORT  comma-separated list of destination ports to trace.

examples:
    ./tcpconnect           # trace all TCP connect()s
    ./tcpconnect -t        # include timestamps
    ./tcpconnect -p 181    # only trace PID 181
    ./tcpconnect -P 80     # only trace port 80
    ./tcpconnect -P 80,81  # only trace port 80 and 81
실패한 exec()의 Syscall 추적
실패한 exec() 시스템 호출을 추적하려면 아래와 같이 opensnoop과 함께 -x 옵션을 사용하세요.
$ sudo ./opensnoop -x

PID    COMM               FD ERR PATH
15414  pool               -1   2 /home/.hidden
15415  (ostnamed)         -1   2 /sys/fs/cgroup/cpu/system.slice/systemd-hostnamed.service/cgroup.procs
15415  (ostnamed)         -1   2 /sys/fs/cgroup/cpu/system.slice/cgroup.procs
15415  (ostnamed)         -1   2 /sys/fs/cgroup/cpuacct/system.slice/systemd-hostnamed.service/cgroup.procs
15415  (ostnamed)         -1   2 /sys/fs/cgroup/cpuacct/system.slice/cgroup.procs
15415  (ostnamed)         -1   2 /sys/fs/cgroup/blkio/system.slice/systemd-hostnamed.service/cgroup.procs
15415  (ostnamed)         -1   2 /sys/fs/cgroup/blkio/system.slice/cgroup.procs
15415  (ostnamed)         -1   2 /sys/fs/cgroup/memory/system.slice/systemd-hostnamed.service/cgroup.procs
15415  (ostnamed)         -1   2 /sys/fs/cgroup/memory/system.slice/cgroup.procs
15415  (ostnamed)         -1   2 /sys/fs/cgroup/pids/system.slice/systemd-hostnamed.service/cgroup.procs
2548   compiz             -1   2
15416  systemd-cgroups    -1   2 /run/systemd/container
15416  systemd-cgroups    -1   2 /sys/fs/kdbus/0-system/bus
15415  systemd-hostnam    -1   2 /run/systemd/container
15415  systemd-hostnam    -1  13 /proc/1/environ
15415  systemd-hostnam    -1   2 /sys/fs/kdbus/0-system/bus
1695   dbus-daemon        -1   2 /run/systemd/users/0
15415  systemd-hostnam    -1   2 /etc/machine-info
15414  pool               -1   2 /home/tecmint/.hidden
15414  pool               -1   2 /home/tecmint/Binary/.hidden
2599   dconf-service      -1   2 /run/user/1000/dconf/user
...
특정 프로세스 기능 추적
아래의 마지막 예는 사용자 정의 추적 작업을 실행하는 방법을 보여줍니다. 우리는 PID를 사용하여 특정 프로세스를 추적하고 있습니다.
권장 자료: Netdata – Linux용 실시간 성능 모니터링 도구
먼저 프로세스 ID를 결정합니다.
$ pidof firefox

15437
나중에 맞춤 trace 명령을 실행하세요. 아래 명령에서 -p는 프로세스 ID를 지정하고, do_sys_open()은 두 번째 인수를 문자열로 포함하여 동적으로 추적되는 커널 함수입니다.
$ sudo ./trace -p 4095 'do_sys_open "%s", arg2'

TIME     PID    COMM         FUNC             -
12:17:14 15437  firefox      do_sys_open      /run/user/1000/dconf/user
12:17:14 15437  firefox      do_sys_open      /home/tecmint/.config/dconf/user
12:18:07 15437  firefox      do_sys_open      /run/user/1000/dconf/user
12:18:07 15437  firefox      do_sys_open      /home/tecmint/.config/dconf/user
12:18:13 15437  firefox      do_sys_open      /sys/devices/system/cpu/present
12:18:13 15437  firefox      do_sys_open      /dev/urandom
12:18:13 15437  firefox      do_sys_open      /dev/urandom
12:18:14 15437  firefox      do_sys_open      /usr/share/fonts/truetype/liberation/LiberationSans-Italic.ttf
12:18:14 15437  firefox      do_sys_open      /usr/share/fonts/truetype/liberation/LiberationSans-Italic.ttf
12:18:14 15437  firefox      do_sys_open      /usr/share/fonts/truetype/liberation/LiberationSans-Italic.ttf
12:18:14 15437  firefox      do_sys_open      /sys/devices/system/cpu/present
12:18:14 15437  firefox      do_sys_open      /dev/urandom
12:18:14 15437  firefox      do_sys_open      /dev/urandom
12:18:14 15437  firefox      do_sys_open      /dev/urandom
12:18:14 15437  firefox      do_sys_open      /dev/urandom
12:18:15 15437  firefox      do_sys_open      /sys/devices/system/cpu/present
12:18:15 15437  firefox      do_sys_open      /dev/urandom
12:18:15 15437  firefox      do_sys_open      /dev/urandom
12:18:15 15437  firefox      do_sys_open      /sys/devices/system/cpu/present
12:18:15 15437  firefox      do_sys_open      /dev/urandom
12:18:15 15437  firefox      do_sys_open      /dev/urandom
....
요약
BCC는 추적 시스템 성능 모니터링, 추적 블록 장치 I/O, TCP 기능, 파일 시스템 작업, syscall, Node.js 프로브와 같은 다양한 시스템 관리 작업을 위한 강력하고 사용하기 쉬운 도구 키트입니다. , 그리고 더 많은 것들이 있습니다. 중요한 점은 도구를 안내하는 여러 예제 파일과 매뉴얼 페이지가 함께 제공되어 사용자 친화적이고 안정적이라는 것입니다.
마지막으로, 아래 댓글 섹션을 통해 주제에 대한 생각을 공유하고, 질문하고, 유용한 제안이나 건설적인 피드백을 제공하여 우리에게 답장을 보내실 수 있습니다.
자세한 내용 및 사용법을 확인하려면 https://iovisor.github.io/bcc/를 방문하세요.