systemd-analyze - Linux에서 시스템 부팅 성능 통계 찾기
systemd 시스템 및 서비스 관리자를 사용 중이고 Linux 시스템을 부팅하는 데 시간이 더 걸리거나 시스템 부팅 성능 보고서를 보고 싶습니까? 그렇다면, 당신은 올바른 장소에 도착했습니다.
이 기사에서는 시스템 관리를 위해 systemd의 수많은 유틸리티 중 하나인 systemd-analyze를 사용하여 Linux 시스템 부팅 성능 통계를 분석하는 방법을 보여줍니다.
추가 읽기: 원격 Linux 서버에서 시스템 서비스를 제어하는 방법
시스템 부팅 시간에 대한 개요를 보려면 다음과 같이 인수 없이 systemd-analyze 명령을 실행할 수 있습니다. 여기에는 부팅하는 동안 커널, initrd 및 사용자 공간에 소요되는 시간을 포함하여 각 서비스를 시작하는 데 걸린 시간에 대한 정보가 나열됩니다.
systemd-analyze

Startup finished in 884ms (kernel) + 3.861s (initrd) + 48.356s (userspace) = 53.102s
실행 중인 모든 장치의 목록을 초기화하는 데 걸린 시간(가장 높은 시간이 맨 위에 표시)별로 정렬되어 표시되도록 하려는 경우 Blame 하위 명령이 이 목적으로 사용됩니다. 다음 명령을 실행한 후 목록에서 더 많은 서비스를 보려면 [Enter]를 누르고 종료하려면 q를 누르세요.
systemd-analyze blame
         16.159s mariadb.service
         12.178s libvirtd.service
         10.298s tuned.service
          9.836s postfix.service
          8.704s lsws.service
          7.352s lscpd.service
          4.988s [email
          4.779s NetworkManager-wait-online.service
          4.577s lvm2-monitor.service
          4.439s ModemManager.service
          4.413s polkit.service
          4.280s dev-sda1.device
          4.225s systemd-udev-settle.service
          3.957s firewalld.service
          3.227s rhel-dmesg.service
          3.221s abrt-ccpp.service
          3.142s rsyslog.service
          3.053s avahi-daemon.service
          3.042s pure-ftpd.service
          2.249s gssproxy.service
          2.212s NetworkManager.service
          1.889s proc-fs-nfsd.mount
          1.780s systemd-tmpfiles-setup-dev.service
          1.451s sshd.service
          1.267s rhel-readonly.service
          1.035s sysstat.service
          1.001s rpc-statd-notify.service
           910ms systemd-logind.service
           739ms kdump.service
           738ms network.service
...
위의 출력에서 볼 수 있듯이 각 유닛이 소요 시간을 기준으로 정렬되어 있으므로 부팅 시 어떤 서비스가 시간이 더 오래 걸리는지 간단하게 파악하고 문제를 분석할 수 있습니다.
다음으로, 표시된 것처럼 임계 체인 하위 명령을 사용하여 기본 대상에 대한 시간 임계 체인 트리 또는 지정된 유닛 목록을 볼 수도 있습니다.
systemd-analyze critical-chain
The time after the unit is active or started is printed after the "@" character.
The time the unit takes to start is printed after the "+" character.

multi-user.target @48.342s
└─mariadb.service @31.560s +16.159s
  └─network.target @31.558s
    └─network.service @30.819s +738ms
      └─NetworkManager-wait-online.service @26.035s +4.779s
        └─NetworkManager.service @23.821s +2.212s
          └─network-pre.target @23.821s
            └─firewalld.service @19.863s +3.957s
              └─polkit.service @15.381s +4.413s
                └─basic.target @12.271s
                  └─sockets.target @12.271s
                    └─virtlockd.socket @12.270s
                      └─sysinit.target @12.251s
                        └─systemd-update-utmp.service @12.196s +54ms
                          └─auditd.service @11.705s +486ms
                            └─systemd-tmpfiles-setup.service @11.609s +93ms
                              └─rhel-import-state.service @11.397s +211ms
                                └─local-fs.target @11.363s
                                  └─run-user-0.mount @46.910s
                                    └─local-fs-pre.target @10.575s
                                      └─lvm2-monitor.service @5.996s +4.577s
                                        └─lvm2-lvmetad.service @7.376s
                                          └─lvm2-lvmetad.socket @5.987s
                                            └─-.slice
systemd-analyze critical-chain ntp.service networking.service
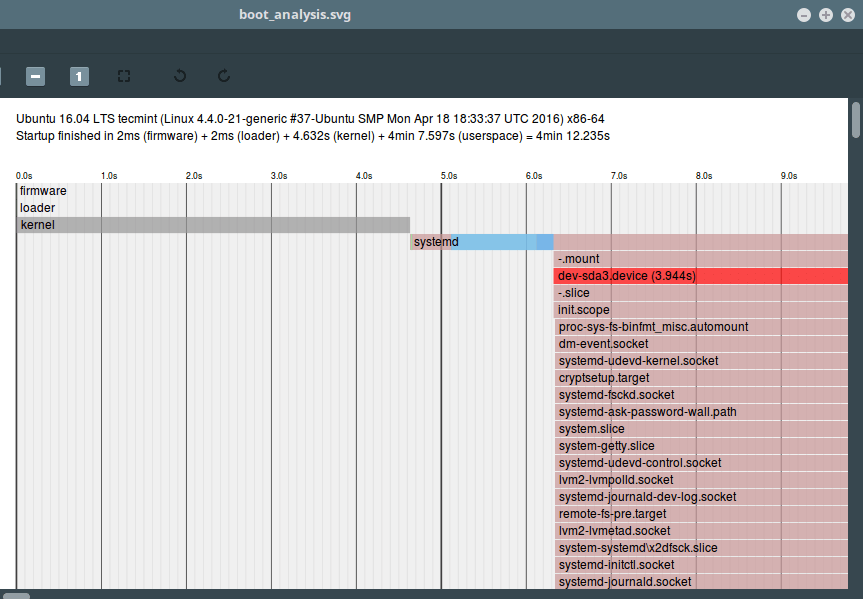
마지막으로, 시작된 시스템 서비스에 대한 자세한 그래픽(svg 형식) 생성과 초기화 시간을 강조하는 시간을 생성할 수 있는 또 다른 중요한 하위 명령을 살펴보겠습니다.
플롯을 보려면 그래픽 디스플레이 모드 또는 x-windows가 활성화되어 있는지 확인하십시오.
systemd-analyze plot > boot_analysis.svg
xviewer boot_analysis.svg
위의 모든 명령은 로컬 시스템의 부팅 성능 통계를 인쇄합니다. ssh를 통해 원격 호스트의 정보를 보려면 표시된 대로 -H 플래그를 사용하고 username@host 지시어를 지정합니다.
systemd-analyze time -H [email
systemd-analyze blame -H [email
systemd-analyze critical-chain -H [email
systemd-analyze는 시스템 및 systemd(서비스 관리자) 등에서 다른 상태 및 추적 정보를 찾는 데에도 사용할 수 있습니다. 자세한 내용은 해당 매뉴얼 페이지를 참조하십시오.
man systemd-analyze
추가 읽기: SystemD에서 실행 수준(대상)을 변경하는 방법
지금은 그게 다야! 질문이 있거나 공유하고 싶은 내용이 있으면 아래 피드백 양식을 사용하여 당사에 문의해 주세요.